| date | week | topic | module |
|---|---|---|---|
| 31 October 2023 | 1 | Welcome & get ready for the course | module 1 |
| 07 November 2023 | 2 | Data science lifecycle & Exploratory data analysis using visualization | module 2 |
| 14 November 2023 | 3 | Data transformation with dplyr | module 3 |
| 21 November 2023 | 4 | Data import & Data organization in spreadsheets | module 4 |
| 28 November 2023 | 5 | Conditions & Dates & Tables | module 5 |
| 05 December 2023 | 6 | Data types & Vectors & For Loops | module 6 |
| 12 December 2023 | 7 | Pivoting & joining data | module 7 |
| 19 December 2023 | 8 | Break | NA |
| 26 December 2023 | 9 | Break | NA |
| 02 January 2024 | 10 | Break | NA |
| 09 January 2024 | 11 | Work on Capstone project | NA |
| 16 January 2024 | 12 | Writing functions & Creating a website with Quarto and GitHub pages | module 8 |
| 23 January 2024 | 13 | openwashdata webinar: a data sharing workflow that may please the publishers | NA |
| 30 January 2024 | 14 | Using AI for software development in R | module 9 |
| 06 February 2024 | 15 | Work on Capstone project | NA |
| 13 February 2024 | 16 | Final submission date of Capstone project | NA |
| 20 February 2024 | 17 | Graduation party of openwashdata academy | module 10 |
Data types & Vectors & For Loops
ds4owd - data science for openwashdata
2023-12-05
Figure cross references
The presence of the caption (A few penguins) and label (#fig-penguins) make this figure reference-able:
See @fig-penguins for data on a few penguins.
becomes:
See Figure 1 for data on a few penguins.
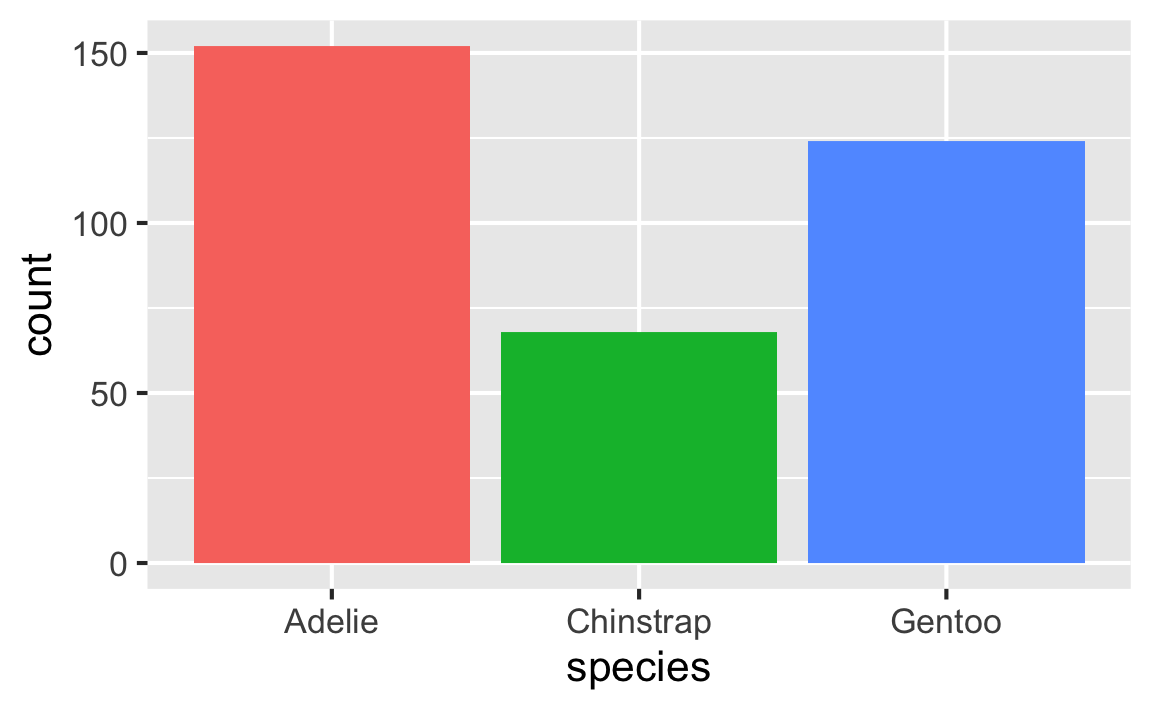
Figure 1: A few penguins
Take a break
Please get up and move! Let your emails rest in peace.
10:00
Take a break
Please get up and move! Let your emails rest in peace.
10:00
A grammar of data tidying

The goal of tidyr is to help you tidy your data via
- pivoting for going between wide and long data
- splitting and combining character columns
- nesting and unnesting columns
- clarifying how
NAs should be treated
Pivoting data
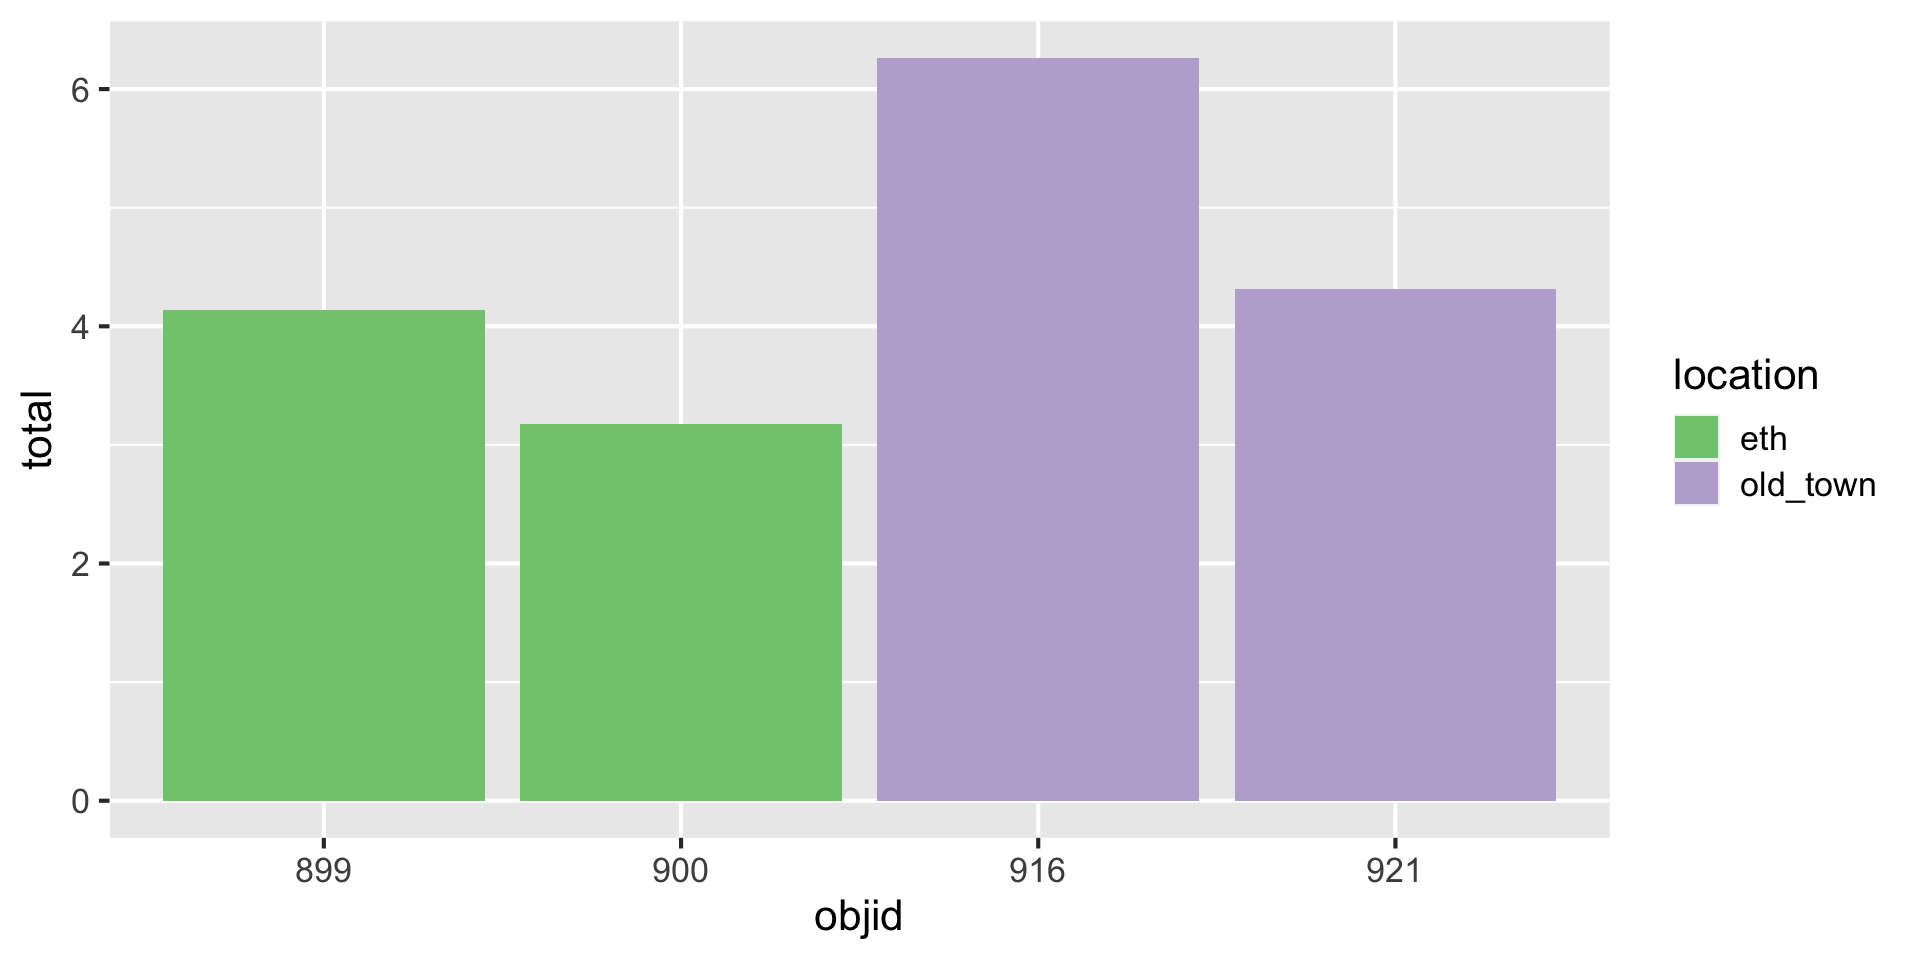
How would you plot this?

Three variables -> three aesthetics
And how to plot this?

Three variables -> three aesthetics
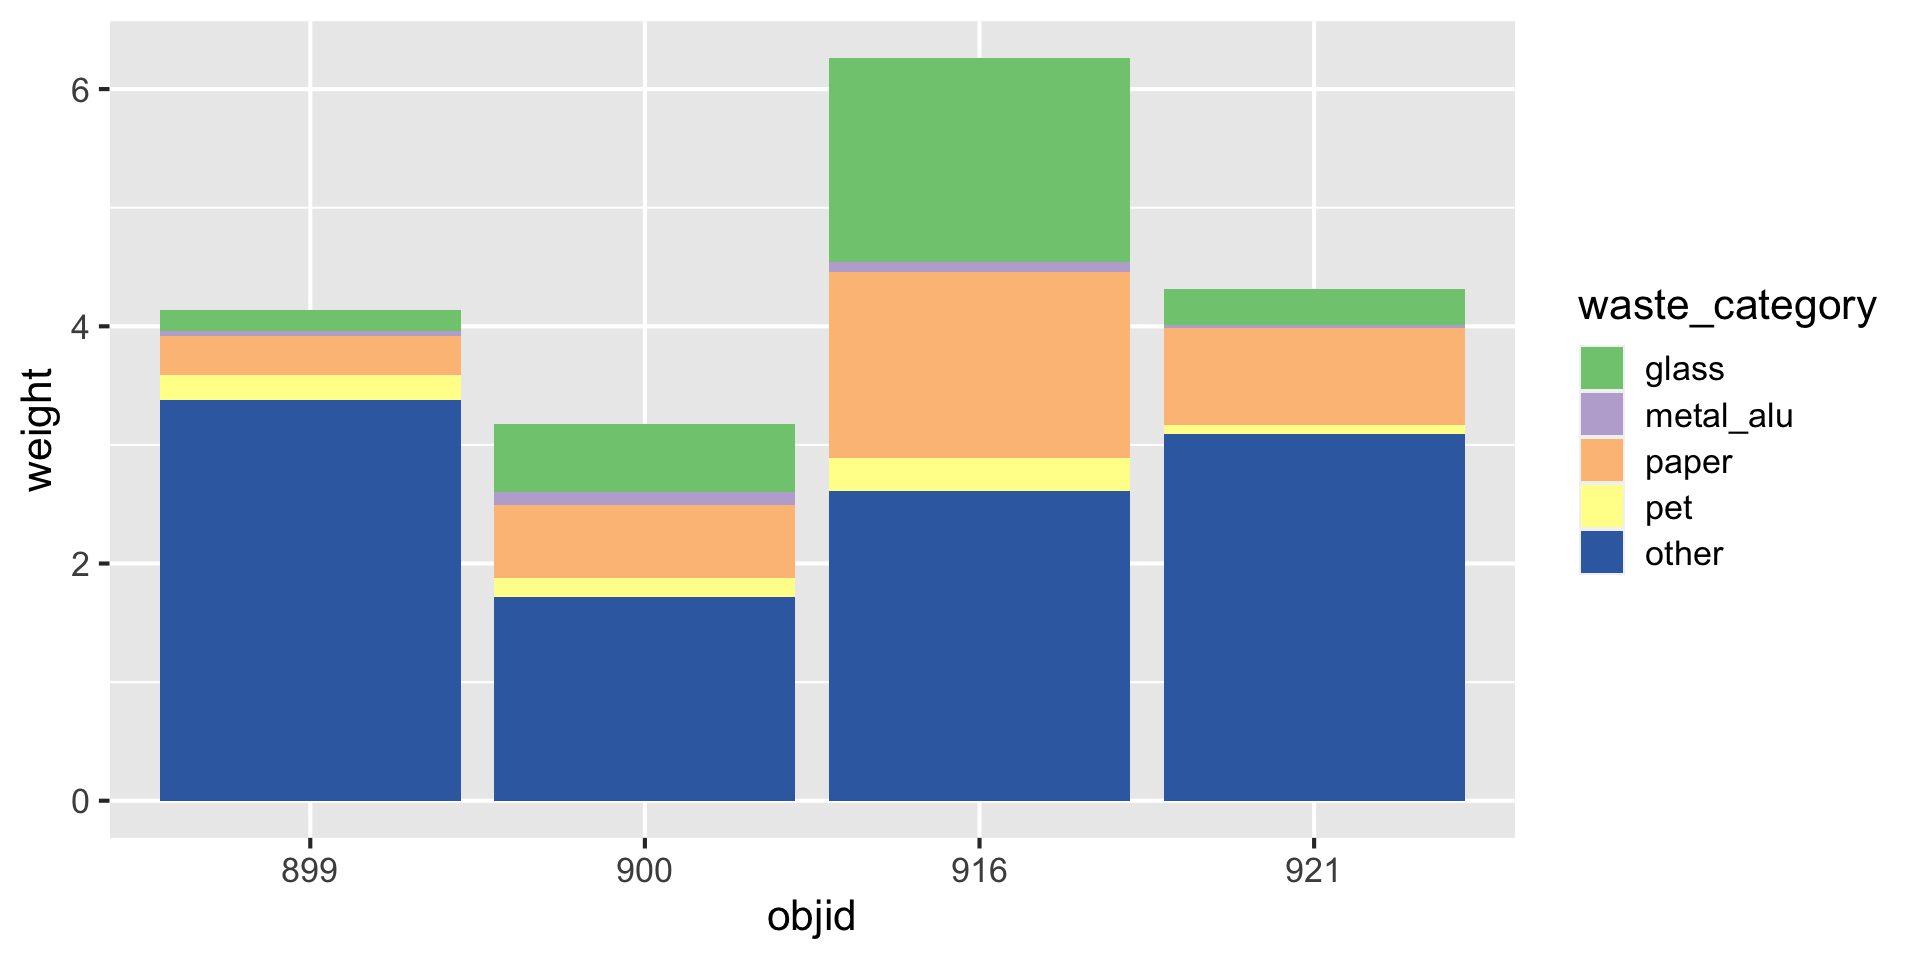
Three variables -> three aesthetics

References
![]()
Ben Aleya, Ali, Daniel Biek, Lin Boynton, Julia Jaeggi, Sebastian Camilo Loos, Chiara Meyer-Piening, Jonathan Olal Ogwang, et al. 2022. “Research Beyond the Lab, Spring Term 2022, Global Health Engineering, ETH Zurich. Raw Data and Analysis-Ready Derived Data on Waste Management in Public Spaces in Zurich, Switzerland.” Zenodo. https://doi.org/10.5281/ZENODO.7331120.